Adaptive Workflows
PlanTest workflows are the custom processes used to evaluate and process plans or dealings. These may vary with submission type, and date. They may be easily created and modified by PlanTest users.
We use the notion of an examination to mean the overall process of evaluation of a plan or document and the subsequent decision to accept or reject. This process is implemented inside PlanTest as a workflow. The workflow can also extend beyond the examination, to the post processing of the submission. Each examination has a list of criteria and a procedure or checklist to follow in the determination of the quality of a submitted plan or transaction. A decision is almost always based on the outcomes of these stepwise 'tests' of the plan.
Our workflows are easily modified and customised to fit the data and business rules of your cadastre. Each workflow is composed of steps, each of which has many options and properties that you choose to implement the workflow you need. Of course, we can help you build these workflows. However, the workflows can be created with no programming, and are easily modified.
User defined workflows
PlanTest workflows are easily created and modified by cadastral staff with minimal training. Nearly all aspects of the workflow can be altered without programming, with the exception of the deeper automated analysis tests. So there is no required dependency on IT to alter or update workflows. Simple file and database access properties and controls ensure the security of the shared workflow files.

Data specific workflows
You probably have different classes or types of plans, and the rules for these various types are also different. PlanTest uses an easily customized workflow system that encapsulates all of the steps that apply your rules to a class of plans. Furthermore, the proper workflow is automatically selected for a plan based on the plan properties. The examination records the type and version of the workflow, as well as all the analytic test results, comments, and decisions. So you always know what has been done.
PlanTest has core capabilities for full digital cadastral submissions. As such, it is designed to select the proper workflow based on the type of plan or dealing submitted. The core PlanTest data models include a type that is a site specific enumeration of allowable types, which are associated to specific workflows. This association of workflow to submission type is easily customized.
You may have a common examination workflow across many types, or have slight modifications of a core workflow for different submission types. Workflows can be easily constructed from subsets or extensions of other workflows. Seaconis usually assists in the construction of the workflows as part of its services. Thereafter, these workflows are easily maintained by your staff.
Interactive steps
Each workflow is a series of steps. A step is a single unit of examination, or a 'check'. The steps have many properties you choose during the construction of workflows. Steps may be automated or fully interactive- or both. During each step you can use free-form cadastral and map tools, run custom automated tests, review results and of course make decisions to pass or fail the step.
User defined step properties
Workflows have step properties that you control by editing the workflows. Changing these properties allow you to alter the User Interface and reports. Other properties for decisions that you can also set are discussed later.
- Name (string). A simple descriptive name that will be used in the UI and reports.
- Tip (string). Short text description shown when cursor hovers over the step in tree UI
- Description (string). Text describing the step or giving instructions to the user.
- Test (string). Name of an automated test if one is available
- Auto (Boolean). True if a step cannot be used in batch analysis, usually because it requires user input
- Views (string collection). A collection of zero or more visualization objects
- Messages (string collection). A collection of zero or more message objects
- Children (step collection). A collection of zero or more steps grouped under the step
Automated decisions
You may set steps to record a decision based on an automated test, and not require a choice from the examiner. This is a reasonable choice when the automated test is completely trusted. The decision for the step may be subsequently overridden by an examiner in the interactive mode. In such cases, you may also require a comment explaining the override.
The automatic step decision function must be included as part of the automated test. Manual decisions are the standard for workflow steps.
Manual decisions
You may require all decisions to be made by the examiner. This is the default. Decisions are made using the Decisions Toolbar for steps with automated tests to produce reports. Steps that are visual only may use the checkboxes in the Analysis Control workflow tree.

Control of decision type
Workflows control the decision method used for each step independently. The decision methods are: automatic, manual after custom test, manual after step execution, and manual using checkboxes on workflow tree UI. This allows complete flexibility to match decision methods to the step.
If the step is associated with a well vetted automatic analytic test, then an automatic decision can be used (or not). This is accomplished by setting the decision state in the test code module (requires programming).
Without the decision state set in the code, an executed step shows the test results and the decision toolbar. The decision must be taken manually.
Steps may not have test code, yet have map views that show specific aspects of the plan data. We call these visual tests. When the step is executed interactively from the Analysis Control, the map view changes and a simple test report is shown that displays the text from the step documentation property and the decisions toolbar. This methode can be used to force the reading of instructions and visual review of selected parts of the plan. Map views may include complex data filtering and labeling.
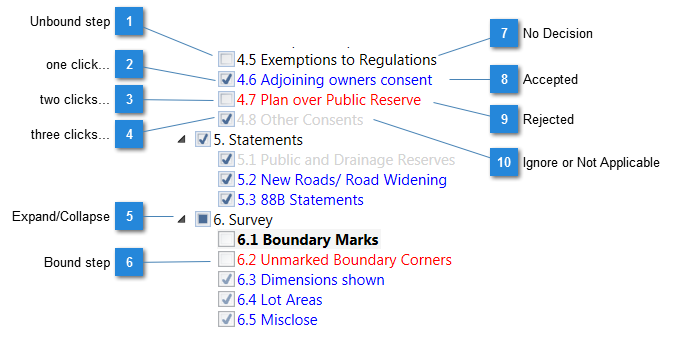
Full flexibility is provided when the examiner is allowed to simply check the checkboxes on the workflow tree in the Analysis Control UI. This sets the decision for the step (repeated clicks cycle through the decision options). This may be used for very speedy handling of offline or often unnecessary steps.
Linked map views
Each step in the workflow may be associated with one or more map views. The map views are applied to the current map to show specific aspects of the plan that are pertinent to the step subject. Map views map include all aspects of the map including symbology, categorisation on feature attributes, labeling from specific properties, graphic elements, selection and display of features with certain properties, zoom and pan to specific features and more.
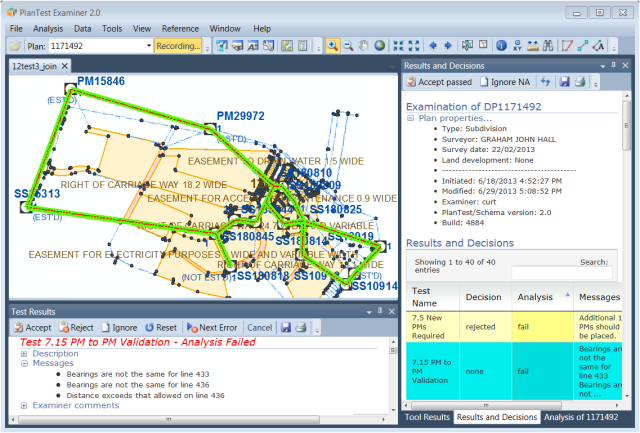
Most likely you will have a set of standard layers that follow your cartographic standards. Each of these would control the cartographic display of a fabric subclass: parcels, lines, points and so forth - or any GIS layer. References to the standard layers are then made in the workflow.
You will also likely create another set of layers that are used only for a class of steps, or for only one specific step. For instance, if you have a series of steps and tests related to control points, you may have map views that highlight the control and provide extensive labeling that would be distracting if applied in other steps.
Automated tests and analysis
The full power of PlanTest is expressed when you have tests that perform the checks automatically. These tests are code modules that follow a standard programmatic structure allowing their execution and integration into the PlanTest framework. Generally, Seaconis will prepare these tests under your direction, often using existing standard tests as a start. We can continue maintenance on these tests as an extension of PlanTest, easing the custom software burden.
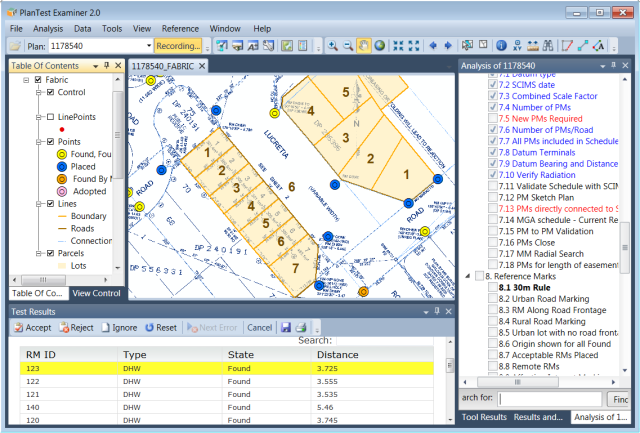
The tests and customised data model for a site are delivered separate from the core PlanTest modules. This allows updates and extensions to the site specific test code, independent of a release of PlanTest. This separation of customisation allows for responsive services, while maintaining stability in the core software.
New tests may be written and added to the site installation as new modules, without alteration of the existing install. Once the test module is plugged in, the tests may be referenced by the workflows and used in the examination.
Tests can range from very simple to complex. One might simply check that certain plan properties are within a specific range, or make a request of an existing service for a database record and compare it to the submission value. Another test might check all reference marks against a complex set of rules that require knowledge of past survey records as well as running ad hoc traverses through the survey data.
Visual tests
Steps may not have an associated analysis test, yet have map views that show specific aspects of the plan data. We call these visual tests. When the step is executed interactively from the Analysis Control, the map view changes and a generalized report is shown that displays the text from the step documentation property and the decisions toolbar. This type of test can be used where visual review of selected parts of the plan is sufficient or when an analytic test may not be possible.
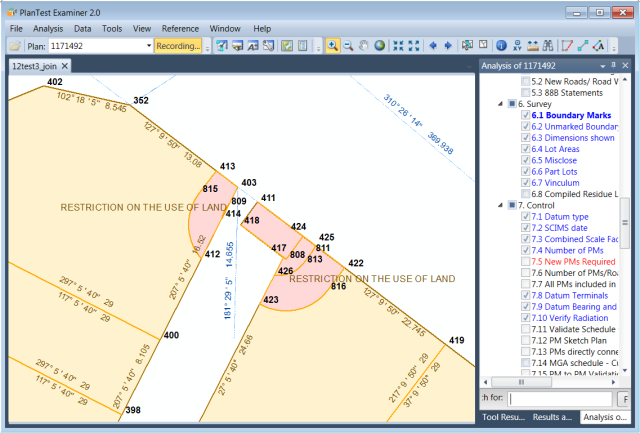
Visual steps/tests should not be underestimated. If the map views are well constructed, it may take only a few seconds to evaluate the step and make a decision. Map views may include complex data filtering and labeling and be quite powerful. Visual tests are often the first phase leading to the subsequent development of an automated analytic test.
Analysis and Examination
When using PlanTest, much of your time will be spent performing analysis and conducting examinations. In fact, the main benefit of digital data is that we can perform any sort of analysis we choose. Even better, once the analytic routines are built, we have tools we can use over and over, with near instantaneous and consistent results. Analysis of the transaction data in cadastre is the key notion of PlanTest, and this is what gives us the ability to quickly, yet rigorously, examine submissions.
This section presents the functions and interfaces that allow the analysis of survey and dealing data, followed by the methods used to make and record judgments, step by step, which culminate in an final decision.
Analysis workflow user interface
The Analysis Control presents the examination workflow. It is highly interactive, information rich, and is the primary tool in PlanTest. It presents both the actions you can perform, and visual feedback of the results and decisions you make.
The workflow is presented as a tree, which allows a step to have child steps. This overall organization simplifies long and complex workflows. Of course, the tree structure is created in your custom workflows.
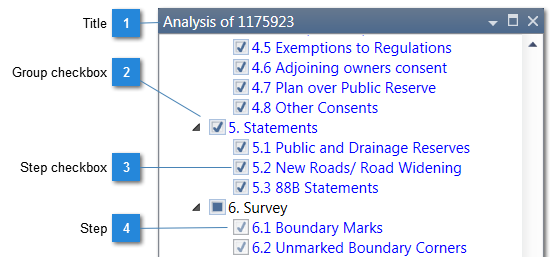
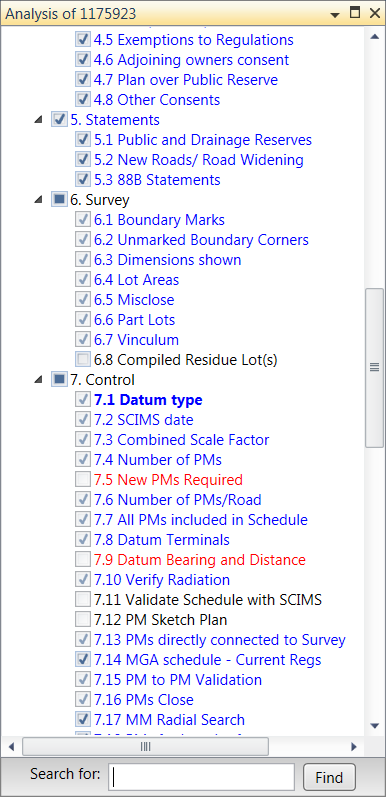
Visually, the status of the examination is apparent from the checkboxes. In the default UI, a check means the step has been accepted as satisfied. A step that is a parent will have a checked state based on the child steps. If all child steps are checked, then it is checked. A step may expanded or collapsed, if it has children. Usually, a parent is solely an organizational group name, but it may have a specific view. It should not have an associated test, because the checkbox status of a parent is dependent on the status of the children.
Manual step execution
A step may be executed by double clicking the node in the workflow tree. This will apply any associated map views to the main map and inset map if one is open. If there is an associated analytic test, it will be executed and the results presented in the Test Results window.
Unless an automated decision is part of an associated test, the decision activity is separate from the execution of the step. Decisions are applied using either the results window toolbars, or by interaction with the checkboxes in the workflow tree.
Batch execution - run all tests
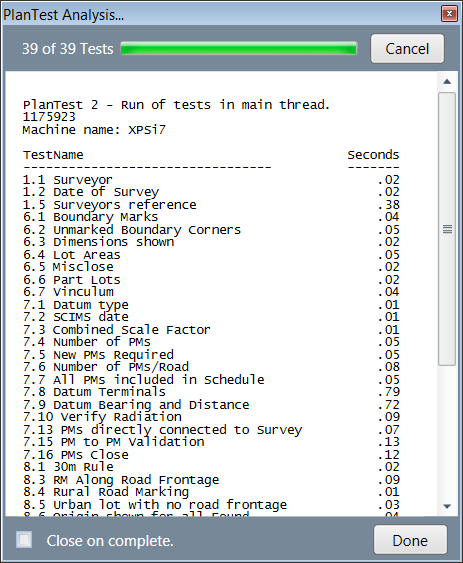
All automated analysis tests can be run in a single batch execution. All results are collected in the examination file, and a special interactive report for review all the automated test results will open once the batch run is finished. A monitor window is shown during execution so you can review the performance of the tests. The review report allows group decisions to be made on steps based on analytic results.
Test results
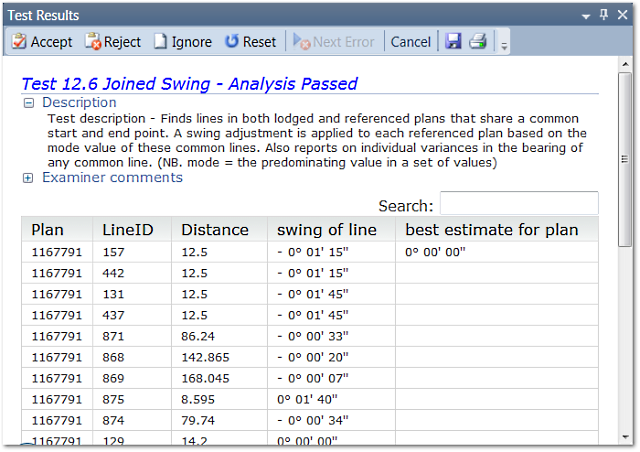
Test results are presented in one of several report types depending on the context. The basic Test Results window shows all test result detail, including meta information and messages. There are also summary reports, where each test is a record in a table showing the analysis result and decision status. Selection of a test in this table will open the test results window to show full detail.
At the completion of an analytic test, the results are presented in the test results window. The results are shown using any presentation layer customisations for the site. These results include a collection of metadata concerning the test: the test name, success or failure, and a description of the test. Messages are text descriptions of errors found by the test or upon successful completion. You can add comments using the text box within the Examiner Comments node, and they will be saved along with the results in the examination records.
Most test results include a table reporting characteristics and calculations related to the specific features and rules being analysed by the test. These tables allow sorting on multiple columns, and the records are linked to map features such that selection of the record will navigate the map view to show the feature.
Decision controls
A decision can be made using controls that are integrated into the different results reports and the analysis control workflow tree. The style of interaction is specific to the type and functional context. For example, there is a decision toolbar in the test results window that can be used to set or reset decision status.

Also, the batch results report allows acceptance of all steps that pass the analytic tests in one button click, and handles all steps that do not apply to the current plan in the same manner.

Recording
During analysis and examination, all test results and decisions are recorded real-time. Recording can be paused, to allow for free-form inspection, and then restarted. The recording controls have a visual feedback, so it is obvious when the system is not recording. (The pause feature can be disabled through site configuration.)

Results and decisions are saved to a file or database, depending on site preferences and configurations. The examination record is identified according to the naming convention of the plan or data packet under examination. The location of the examination results folder or database is configurable. Cutomisation of the examination content and format is expected as part of site adaptation..
Tests, Results and Reports
Tests are central to PlanTest. Although it is possible to configure and use PlanTest with no automated tests at all, it is expected that most jurisdictions will have many analytic tests. Their benefits are simply too attractive to ignore. Seaconis can build jurisdiction specific tests, often by simple modifications of existing tests.
Test results are presented in one of several report types depending on the context. The basic Test Results window shows all test result detail, including meta information and messages. There are also summary reports, where each test is a record in a table showing the analysis result and decision status. Selection of a test in this table will open the test results window to show full detail.
At the completion of an analytic test, the results are presented in the test results window. The results are shown using any presentation layer customisations for the site. These results include a collection of metadata concerning the test: the test name, success or failure, and a description of the test. Messages are text descriptions of errors found by the test or upon successful completion. You can add comments using the text box within the Examiner Comments node, and they will be saved along with the results in the examination records.
Most test results include a table reporting characteristics and calculations related to the specific features and rules being analysed by the test. These tables allow sorting on multiple columns, and the records are linked to map features such that selection of the record will navigate the map view to show the feature.
Standard tests
Seaconis has a number of standard tests. These tests use the core Seaconis Objects, and perform very common validations and computations. Two examples are the comparison of stated lot areas to areas calculated from boundary measures or point coordinates and comparisons of survey control interconnection bearings and distances to calculations from schedule coordinates.
It is important to understand the direct link between tests and the data model. Although many cadastral concepts are the same between nations and jurisdictions, the specifics of terminology, measures and rules almost always require a modification of the core data model, and certainly extensions to the core data model to fit the existing cadastral system. The need to modify the data model means that standard tests, though close to the mark, must be customised to some extent before they can be used. However, these changes are often trivial and inexpensive.
Custom tests
Seaconis can build custom tests to work with your jurisdictional data model. This is facilitated by the PlanTest architecture which was designed to allow deep modification of the internal object model. Custom tests can be virtually anything. Simple tests might check a plan property like the surveyor name against an enterprise database using a network service.
A more complex test may perform tasks not otherwise feasible or even possible, at least not given resource constraints. An example would be a comparison the swings between the examination plan and older plans in an overlay fabric, and subsequent comparisons of measures between the plans using the swing adjustments. Or perhaps you need an involved check of complex survey regulations applying to traverses and ties to lot corners.
Custom tests may have their own business rules, with assorted messages based on data conditions. They may have their own table structure, with columns and records using specific data attributes and computed values. The tests may perform considerable data manipulation and computation, both within the subject plan or relative to other reference data.
Tests and steps
In our terminology a step is an item in the workflow that must be reviewed and judged. It corresponds to an entry in a checklist. A test is a program that performs an analysis on the examination data. A step may of course use a simple visual test, without the automated analysis.
So not all steps must have an analytic test, but there is a one to one correspondence between a test and a step. A test should be associated with only one step, and other properties of that step, such as the associated map views, should match the purpose of the test. A test may select certain features on the map, such as boundaries that are designated as adjacent to roadways. The map view should also label and depict the features to identify the features if interest clearly.
Tests should be independent of the results of previous tests. This ensures that all tests can be executed before a submission is rejected and sent back for correction - all errors that can be found should be found.
Examples of tests
This
Test results
When an analytic test is completed, the results of the test are shown in the test results window. Results are presented according to the customizations for each site. Generally, the window may show a collection of metadata concerning the test: the test name, success or failure, a description of the test, test related messages, and a table of results. Messages are text descriptions of errors found or of information or successful completion. You may add comments using the text box within the Examiner Comments node, and they will be saved along with the results in the examination records.
Next error navigation
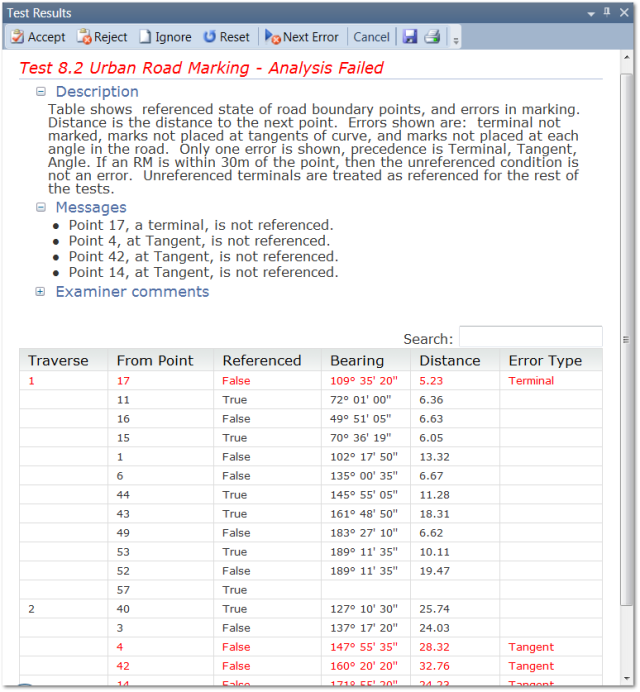
Some tests return many records structured to show hierarchy in the data (grouping, sequencing). Some of these records will present errors. Error records are highlighted. However, when many errors are found and the tables are long, the 'Next Error' function makes it easy to move from one error to the next to investigate the causes.

The next error function is on the decision toolbar at the top of the test results window. This is an example of locating and showing functions where and when they are needed. When the button is clicked the table will scroll to the next error record and it will be selected. Selection of the record causes the current zooming map to pan and zoom to the feature in error. (Not all error records are associated with features - and no map zoom will occur in these cases.)
Run-all-tests report
In the best of all possible worlds, you press a button and your job is done. If all of your workflow steps have automated tests, then the run-all-tests command comes close, but you still have to review the results and make your decisions. Realistically, you will be able to resolve most simple submissions, but the experienced human touch will always be required for the special cases.
Let's say you have 100 automated tests, and you have worked with them long enough to know they will give the correct results. What then is the best way to review the results and enter your decisions?
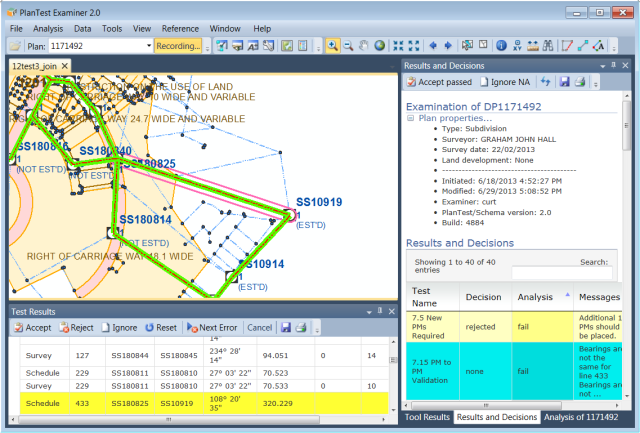
A special report helps you review a large number of test results quickly. It presents a table with the name of the test and the analytic pass/fail for each test as a record. Other columns show messages, and yes, this table is easily customised. The report window also has a toolbar with buttons that you may use to set the decision status for certain groups of tests. One button will pass all steps that pass their tests, and another will choose to ignore any tests that return an analysis response that the test does not apply to the plan.
If you select a record in this table (a simple mouse click), the test results window will present all the test detail as if you had run the test interactively. This is the way you investigate tests that fail. You can review all test detail, investigate using all the maps and cadastral tools, and then make your decision.
Error logging
Administration of PlanTest is assisted by a comprehensive error logging function. This will help with resolution of problems in the installation and configuration of PlanTest. It can also add to the ability to decipher problems with data.
Plantest can perform all data workflow functions from portal to archives. Errors in the source data can be discovered throughout this process: first in validation of the input file, but also in the analytic tests. Odd behavior must be expected to occur at least on the rare occasion. If the errors are not reported directly in the tests, PlanTest has an error logging system to assist in the determination of the cause for failure.
Current examination report
PlanTest provides a current examination review in a report that is much like the run-all-tests report. Howerver, this report will show the state of all steps in the current workflow, and is not used to set decisions. It can be used to review older examinations as well as a contemporary work.
Summary report
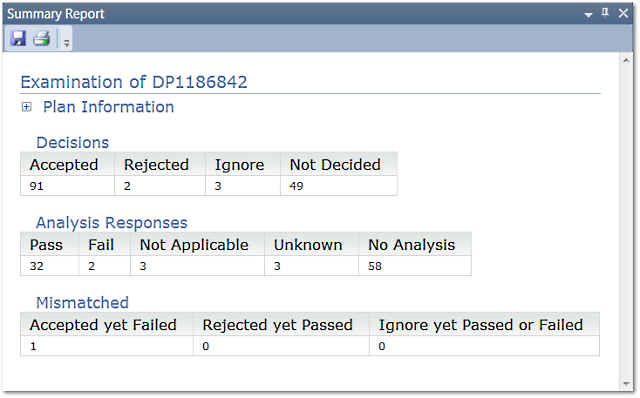
You can use the summary report to show the statistics of the current examination. It gives a complete accounting of the decisions made, and number of steps remaining.
Since steps with tests that pass may be rejected, and steps can be accepted even when a test fails, the standard summary report shows statistics for steps with disagreement between the test result and decision. This should be used to ensure that errors have not been made.
Smart Maps
There is a great deal of information in a cadastral transaction, especially in the survey plan. It can be very difficult to sift through all the data to find a particular element, and then understand its relation to other parts of the survey. You need an edge.
Smart maps in PlanTest provide far more than a drawing in CAD software, or layers in a general GIS package. Analysis gives extensive derived information from the base data. Also, the analytic results are tightly linked tables and maps; in fact, nearly everything is linked. The purpose of linkage is 'context'; the way we alter aspects of the application to suit the needs of the moment. Read on...
Embedded ESRI GIS technology - ArcEngine
PlanTest Examiner uses ESRI technology for the mapping of survey and GIS features. The embedded ESRI map control can display all ArcGIS cartographic layers, data sources and symbology. We use this design for two main reasons. Firstly, it gives PlanTest a 'best of class' mapping system. Secondly, many cadastres or associated government departments have ESRI software and databases already, so it provides a quick way to integrate GIS layers iwththe incomming survey data.
Basically, PlanTest includes the power of ESRI technology without the complexity and extensive specialized training it usually requires. Since the map views are created during site customization, and linked to appropriate steps in the workflow, staff members need no knowledge of ESRI software. The maps just work.
You are not, however, required to keep your cadastral database in an ESRI format. If you base data is not in a ESRI format, PlanTest data transformation modules can build ESRI map documents and ESRI databases on the fly to use in the map control. These transformed data sets can then be discarded when no longer needed.
Automatic maps
PlanTest maps change depending on where you are in the examination. Each step of the workflow alters the map to show the features, categorization, symbols and text and analytic results optimal for understanding a particular view of the data, and the investigation of the test results. This map view can be created and modified by you - without programming. We cannot overstate the power of this approach that maps the survey features and their associated proeprties to fit the workflow. Since it is customisable by you, it and be continually adapted to your needs.
You really need to try it to understand how great it is.
Custom views
A view is a way of looking at the survey and spatial data on a map. The goal of a view should be to limit the complexity of the data, and present only what needs to be seen from a certian viewpoint. In PlanTest, views are created from the properties of one or more layer files. PlanTest uses an embedded ESRI map for map displays.
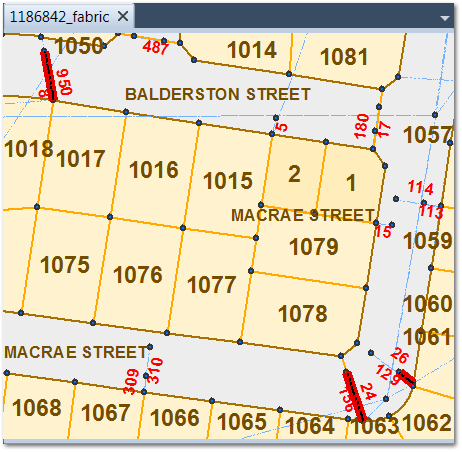
You can build your layer files using any ESRI product that can create a layer file. PlanTest does not use the layer file directly, but reads and applies properties in combination with the properties of other layer files. We use the layer file so you can use all of the ArcMap mapping capabilities to create your desired views. Once created, you save them as layer files, reference these files insdie the views in your workflows, and the rest is automatic.
GIS layers
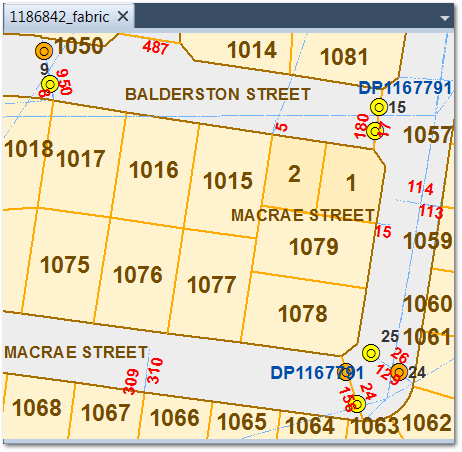
Since PlanTest has an embedded ArcMap control, you can include a wide areay of GIS layers based on various data types. The main reason for the ArcMap control is to display the cadastral data, of course. The added benefit is the ability to include data from any other ESRI supported data sources. These will usually be GIS layers from other government departments, or from legacy cadastral systems. You may also connect to layers on the internet.
You can include GIS layers in one of two ways. Firstly, any ArcGIS map document may be opened in PlanTest, so you simply need to build you map documents using ESRI products. Our expectation is that many clients will have such software at hand. However, if you do not have such software, there is another solution. PlanTest can create an ESRI map document file from various data sources. A special Seaconis XML file is used to hold all references to the cadastral data source, templates for an ESRI personal geodatabase, and georeferenced image files. This is out of the box functionality.
Seaconis will be extending the packet driven import module to support other GIS data types over time. Extension of the loading modules, discussed later, is a common Seaconis service.
Georeferenced images
The most common image we would like to overlay with the cadastral survey data is a scan of a relevant paper plan. A georeferenced image is one that has been fit to the coordinates and spatial reference of the cadastral survey data. This process transforms the image such that the points and lines will match those of the digital survey data drawn to the map.
This match of image features to map features is possible only with features on the paper plan that are drawn to scale. Since it is a common practice on drawings (and in CAD) to shorten the lines that extend out to survey control, some of these lines should not be expected to match. Also, any cartographic adjustments of feature locations to fit all the drawing onto a certain size paper will also not match.
Once an image is georeferenced, the transformation parameters are stored in a world file, and can be used at a future time to place the image in an overlay with the survey data.
Custom dynamic labels
The custom map views discussed previously provide one of the most powerful dynamic labeling systems available in any software. During the creation of the layer files that underlie the views, you can use ESRI mapping software which has extensive labeling functionality (PlanTest does not include licenses for ESRI software). In general, survey data display relies more on labeling than on other types of cartographic symbolization.
Therefore, the labeling in the views is applied along with symbolization for each step in the workflow.
Custom symbols
The embedded ESRI map control can display all ArcGIS cartographic symbology, so you can use your ESRI software to customize the symbology as you wish. Even if you base data is not in a ESRI format, PlanTest data transformation modules build ESRI map documents and database on the fly to use in the cartographic display. You therefore ony need one license of ArcGIS desktop software to create the view files used by PlanTest. All other users will be able to benefit from the best in class cartographic display via the embedded map control.
Interactive maps
All maps used in PlanTest are fully interactive. You can zoom zoom and pan to change the scale of the map and its extent, and bring the area of interest into view with the level of detail you need. The map tools described elsewhere can be used to investigate the properties of the plan features of reference GIS layer features.
Inset maps
Inset maps allow for 'copies' of the main map, usually for a larger scale or 'magnified' view. Think of them as you would insets on a plan drawing. The inset map synchronizes its content and view to match the Main Map. So changes to the views in the main map, that occur when a step is executed, are also applied to the inset map. Of course, view labeling and symbols are often scale dependent - so the inset map may show scale linked information not shown on the main map. The current extent of the inset map is shown on the main map by a graphic.
Many PlanTest data interactions navigate a map to show specific features of interest for a specific test. If an inset Map hs been opened, it will be the focus of the map navigation, otherwise the main map will zoom.
Reference maps
Any number of ESRI map documents may be opened, each with its own window. Although you will often want to display spatial data in a single map, it is sometimes less confusing to use separate maps. Reference maps have their own toolbar, with a full set of commands and tools. They do not have a Table Of Contents control to alter the cartographic qualities or to add and remove layers.
Map specific toolbars
You will often want to use several maps maps in the same PlanTest session. This could lead to confusion if a single map toolbar applied to all maps, and it would limit the efficiency of switching between maps. PlanTest uses a system that provides each map with its own toolbar. Furthermore, this toolbar is specific to the type of map. So an inset map of the main map has a different toolbar than a GIS reference map. This makes it easy to perform separate tasks in differnt maps, as each map can have a different active tool.
Map tools
Interactive maps have a wide array of command buttons and tools that work on the maps and features they contain. An example of a command would be a button that zooms the map out by a fixed amount; its just a button click. A tool makes use of the mouse or other pointing device, for example the Pan tool which lets you click and drag the map to a new location or extent.
As PlanTest makes use of the embedded ESRI map control, there are literally hundreds of tools you could use. This may be powerful, but increases confusion and slows training. In the core PlanTest Examiner UI, we have exposed only those functions that are needed. Other functions may be added as a jurisdictional or site customization.
Cadastral map tools
Some tools are very cadastral specific. In general, these have been developed for customers, and often have a specific implementation for their data model. However, where possible we have generalized these tools for use by all PlanTest operators. A simple misclose, or closing line tool will calculate the closing line for a selected traverse. This does not have to be a specific traverse for a parcel, so it can be used to find more than one calculation for the closing line between two points by either two different traverse choices, or the between two different surveys.

Some general tools are specific to only one type of fabric data model. For instance, an internal angles tool will calculate the internal angles of selected sets of lines. If the fabric has overlying plans, then the results will compare the internal angles between the plans. This is useful to compare surveys without computing swings.
Data upload and conversion
If you are looking for a system that will have a portal for digital plan or transaction submission, then you should be interested in data conversion and loading. Since you will likely have your own data model and data standards, a custom loading module will be required. Seaconis can help you with data models and data manipulation.
PlanTest has a core module which follows the well known Extract/Translate/Load (ETL) architecture. Implemented as plug-in modules, our ETL easily supports a new extraction method to read or write your data transfer formats. Our ETL model separates the functions of reading special formats, with translation into the extensible core Seaconis cadastral data model.
Extract Transform Load (ETL)
ETL is short for extract, transform, load, generally speaking, these are three database functions that are combined into one tool to pull data out of one database or source and place it into another database or form for processing. Extract is the process of reading data from a database, file or stream. Transform is the process of converting the extracted data from its previous form into the form it needs to be in so that it can be used in processing (analysis for PlanTest) be placed into another database. Transformation occurs by using rules or lookup tables or by combining the data with other data. Load is the process of writing the data into the target database or files.
ETL is commonly used to migrate data from one database to another, to form data marts and data warehouses and also to convert databases from one format or type to another.
In PlanTest, we use our ETL for several purposes. Of course, to bring data from its source (extraction). We then transform it into the form for analysis (often in memory only). Finally, it is transformed into a suitable form for insertion and update of your core databases (there can be more than one). The key point is that our use of this database standard approach has been to make it an extensible framework in the product, so customisations for your formats become the same as core.
LandXML
A foundation of every digital cadastre is standardisation of data transferred during transactions. Often, this will be a data format for submissions to a web portal, specific to a country or region. LandXML has been adopted by over 800 software vendors, numerous companies and governments as a means to transfer construction and survey data. In the last few years it has been adopted by Australia and New Zealand as the standard for survey and mapping data. The Intergovernmental Committee on Survey and Mapping (ICSM) has established a detailed specification of LandXML for the transfer of survey data used in cadastres. It is in use by several of the Australian state cadastres, and New Zealand uses LandXML in Landonline, its web portal.
PlanTest supports ICSM LandXML in its ETL data management modules. Specifically, it has read/write capability for the NSW jurisdictional flavor of the ICSM LandXML. Adoption of this translator to other ICSM jurisdictions, or to other LandXML based standards can be part of PlanTest adaption to new sites.
Cadastral XML - CEXML
CadastralXML (CEXML) is a data format first used by Geodata Australia in its GeoCadastre product, and subsequently by ESRI. CEXML can hold a complete fabric that may included a history of surveys joined on common points and adjusted by GeoCadastre using a Least Squares Adjustment specifically tailored to the combination of survey data of both historic and current accuracies.
PlanTest supports CEXML, and it is this format that is used internally for fabric data in by LPI in NSW. LPI uses LandXML for submissions, and then historic survey/plan data is added using GeoCadastre editing. CEXML is then used internally to transmit and store local fabrics. CEXML is superior to LandXML in its ability to hold more than one survey, and properly deal with line points. So it is well suited to the transfer of cadastral fabrics data.
ESRI Geodatabases
PlanTest supports ESRI data sources through its use of embedded ESRI technology. PlanTest can also load data sources, such as CEXML, LandXML and custom survey data formats into ESRI databases and file data stores.
Since PlanTest uses the ESRI ArcMap control to display the plan and survey information during examination, we also support other data types and data sources commonly used by ArcMap.
ESRI files
PlanTest supports ESRI file formats for raster, vector and grid data. PlanTest can use the personal geodatabase or file geodatabase for examination fabrics, as well as fabrics stored in ArcServer SDE databases.
Georeferenced images
The move from paper cadastral systems to digital does not mean there isn't still a good deal of important historic information on paper. You can either convert the paper plans to full cadastral data fabrics (often called vector data) through arduous data entry, or scan the paper plans into images (raster data). Of course, full digital records are most useful for analysis. Many cadastres do some of each.
Scanned images of historic plans are of particular use when shown 'underneath' new plan vector data as it allows visual comparison, without the task of converting all historic plans to true vector digital data. To do this, you must have scanned images transformed to correctly register against the vector data. This is called georeferencing or georectification.
PlanTest's use of ArcMap gives complete control of layers including georeferenced images, with transparency settings and advanced corrections.
Scanned documents
Not all parts of paper plans are survey drawings, many historic documents are simple text, and are not georeferenced. PlanTest has a TIFF file viewer that supports multiple page TIFF files. To make it easy to review these scanned documents, PlanTest provides user controlled rotation, pan and zoom.
Other image file formats can be added as custom project work, but multi-page TIFF files seem to be the standard.
Assemble from sources - packet file
PlanTest uses ArcMap for its mapping platform, and it requires proprietary map documents and data stores. This is a problem if you don't use ESRI as a platform throughout your job workflows. PlanTest makes it easy to create the necessary ESRI data components as needed, dynamically.
We use a special XML file that is created as part of a wider job workflow. It contains the path of any input data (data files, georeferenced images, ESRI databases, or database templates). A single PlanTest function then calls the ETL to extract and transform the data source to load into an ESRI format, create the ESRI map document with appropriate data sources like the fabric and images, and finally, start the examination. It only takes a second or two for normally sized files.
Dynamically created ESRI data and map files can be placed in temporary folders and removed when PlanTest is closed. This is a typical approach since re-creating the files in the background is so fast.
General User Interface Features
PlanTest design is based on a few simple rules. Simplicity - no complex menus and toolbars with multitudes of options no one uses. You need what we need, when you need it. Since examination is a process, we introduce controls where and when appropriate. For example, the test results window has its own toolbar to hold decision and issue investigation buttons. This pattern is reapeated elsewhere.
Automation of actions is another design rule. Where possible, multiple actions should be combined. So you can proceed step by step, or run all steps and their corresponding tests as a batch. You can initiate an examination from a single selection of an SI Packet or assign decisions to an entire group of steps (after review of results one would hope).
We also automate investigation functions, like the linking of a record in a results table to a feature on a map, so the selection of a table record will zoom to the feature on the map. Or the use of a 'Next Error' button to move quickly to the next detected problem. Also, a test result will zoom and pan a map to the location and extent to show the data in question. If an inset map is in use, it is zoomed, and the main map shows the extent of the inset.
Dockable windows
The key design consideration for PlanTest 2.0 was to create an attractive, easy-to-use and modern user interface. We realised that examiners may spend most of their day using PlanTest, so it had to be functional and comfortable. Since there are many types of data, documents and results that are in use at any one time, we needed a way to organize the complexity, and allow it to be molded to the preferences of each individual - not the rules of examination, of course, but the look and feel, the layout and such.
Dockable windows in a multiple document interface (MDI) are the key to this. In PlanTest, windows can be docked to the sides, or in groups, as tabs on the main document window, hidden automatically when not in use, or permenently pinned to a specific location.
Docking operations are aided by docking guides that are truely first class. They make it easy to manipulate the layouts as you work. Many windows functions are also available in context menus and the main menus and toolbars, so they are always at hand. It takes no time to learn the system, and you will be fluent in a single day.
Layout persistence
The arrrangment of the many possible maps, results, controls and documents that are part of the PlanTest examination is within the control of the examiner. Using the dockable windows, you simply create the layout you want to use and then save it. When you next start PlanTest, that layout (including all windows that were open when first saved) will be recreated and placed in their correct location and state.
Theme styling
Not everyone likes blue. In addition to the ability to create your own layouts, you can also choose from a number of themes. These include classic windows themes, aero, office, and a number of others.
User documents
You may open any documents of the supported file types in PlanTest. The document will then be fully incorporated in the PlanTest UI. The window, and contents can become part of a saved layout.
Multiple monitors
Examination of survey data and cadastral plans can be simple or quite difficult, depending on the particular plan and jurisdictional requirments for examination. PlanTest simplifies even the most difficult cases by automated analysis, progressive disclosure of complex data relationships and readily available reference mataerials. This can produce a large number of results windows, maps, controls and documents that can be confusing to the uninitiated. Dockable windows and the MDI make it managable, but more screen space is of great benefit.
The use of multiple monitors enhances the PlanTest experience, and provides the most powerful platform for examination.
Customisation
Cadastral software is possible only if it is designed to be customised. This realisation is at the core of the PlanTest architecture. Customisation goes beyond what many commercial products allow, and it is also much easier. We wanted to make sure that customisation could be done without programming, to the greatest extent possible.
The initial adoption of PlanTest for a jurisdiction is usually done through a service contract. We adapt the data model, and any standard automated tests that apply to the jurisdiction. The specific data model, and special data loaders and the tests, of course, require programming.
The workflows, step documentation, tooltips, messages and map views associated with steps do not require programming and are easily managed by examination staff. Also easily customised are the common reference documents, layouts and themes.
Most importantly, customisation is not affected by releases of PlanTest. The programmatic customisation for data models and tests are all contained in site specific DLLs, which are read by PlanTest at startup. So your site customisation can be changed without a release of PlanTest, or the opposite. All other customisations are not affected by new PlanTest installs.
Seaconis and You
Many customisations in PlanTest can be performed by examination staff. These customisations do not require programming or special knowledge of arcane technology. Other forms of customisation are best left to Seaconis staff.
We made PlanTest customisable for two main reasons: so we can easily create an adaptation for specific jurisdictions without creating new core software changes, and so you can manage your own customisations without our help - and often without the help of the IT dpartment.
It may be that you want us to handle nearly all of the customisation at first. Later, after you have used the software for a while, you will probably start to manage certain things, like workflows and views, on your own. It just gives you more control over your business processes.
Custom data models
PlanTest has a core data model for cadastral data that includes both field survey and parcel fabric models. These models can be extended to include new properties and methods for existing objects, or even to inlcude new objects.
Although cadastres may vary, our core models cover the basic aspects that are fairly common. However, each cadastre emphasises one part of the model over another, or uses different names and properties for similar objects. To resolve this, customisation includes interfaces to translate the specific data model for a jurisdiction to the core SI data model.
ETL for your standards
Data read/write capability is essential for the digital cadastre. We use an advanced Extract/Translate/Load architecture that allows us to add support for new file formats with a minimum of effort. Custom ETL plug-in's also make it easier to use customised data models.
Nearly every cadastre has, or will have, a specific and unique data format for submission of digital plan and survey data to the cadastre. Seaconis can build custom extract and load functions to extend the core ETL module so that you can read, load and write your standard formats, whatever they are.
Database and file options
PlanTest can fill two roles. Firstly, in an established cdastre, it can be inserted as an examination module that is loosley coupled to the existing cadastral system by job control. In this scenario, PlanTest does not need to act on database records themselves. It would typically examine lodged files, that perhaps have been submitted through a web portal, or work on extractions from databases that were created by a job control system. This emphasises PlanTest's role as a validation and quality control subsystem that works against the transaction. In this role, it is more likely that PlanTest will start an examination from a file (the submitted plan) and communicate with the job control system or other parts of the cadastre through services.
Secondly, PlanTest can function as a stand alone system for cadastres without an extensive system. In this role, its workflows become the job control, and it may also be extended to manage the transaction updates to the cadastral databases and registries (usually through a service). In the simplies form, it would work against files only. This could be in a remote office of a cadastre, followed by transmssion to the central system.
This level of customisation is all about how PlanTest is integrated into an existing system. As such, it is something that is done as part of the initial adaptation of PlanTest for a jurisdiction.
Map views
Examination of a cadastral data set, or fabric, can be difficult because there is so much information. If all of this is presented at once, as in a plan drawing, you can sift through the data for each bit you need for a particular check. It is much harder to review several paper plans at once.
PlanTest makes it easy to see just what you need to see for each step of a digital examination. It uses the concept of progressive disclosure to show only the pertinent data, at just the right time.
PlanTest uses 'views' to accomplish this. You create views by using ArcMap to create layer files for specific symbology and labeling of survey elements. These saved layers are then placed in a standard location, which is usually shared at the site, and the layer files are referenced in the PlanTest workflow files as part of the property of a step. A step can reference several views. Usually, these layer files are shared between many steps, for instance, a Standard_Parcels.lyr may show parcel symbolisation that is used for most all steps. Specific layers can be created that are used only for very unique tests.
When PlanTest applies ESRI layers to implement a view, it does not use the layer file directly, but instead reads properties from the layer file and applies them to specific subclasses of features.
Workflows and steps
Each cadastre has different classes or types of plans, and the examination rules for each will usually vary, at least to some extent. PlanTest uses an easily customized workflow system that manages the steps that apply your rules to a class of plans. Furthermore, the proper workflow is automatically selected for a plan based on the plan type. The examination records the type and version of the workflow, as well as all the analytic test results, comments, and decisions.
The workflows are a hierarchical list of steps and logical groups of steps. Each step has properties, such as: the name of the step, the tooltip help for the step, a description of the step, an analytic module for the step that runs a particular program, a set of map views that should be shown, a list of standard messages for the failure of the step, and other such aspects.
New steps and groups of steps can be created by modification of the workflow file. Currently, this is a simple XML file with a specific structure. You simply edit the file. The new steps groups, or even workflow, will then be read by PlanTest and the PlanTest UI will represent the step in the analysis control, where the step can executed.
Of course, new analytic tests will require a program module. However, the site specific tests are held in separate DLL's which can be completely customised by third parties. This is discussed in more detail in a later section.
Reference documents (yours)
Create a custom list of reference documents as simply as dropping files in a folder. Use the PlanTest configuration to point to a shared folder. Any documents in the folder are added to a menu options list on startup. Selection of an option opens a PlanTest dockable window for the type of file, which participates in layout persistence and all other window functions. Supported file types are PDF, ASCII text, rich text, and HTML(web pages). Change your reference documents as needed using standard folder management - it's just that easy.
Layout
Each examiner can have their own special layout. The layout is the way a collection of windows is arranged: their positions and states within the PlanTest MDI. It allows individuals to arrange the software elements in a way that appeals to them, and in which they feel most comfortable working.
Once a layout has been created, all that is needed is to save the layput using the File menu.
Custom tests
Test modules are programs that perform special analysis within the PlanTest framework. They are the heart of automated testing. They can be simple or complex. They can introduce a rigor far beyond what is possible by manual examination, and they are efficient, fast and accountable.
Test modules are written against the custom data model for a cadastre. PlanTest has standard tests, written against its standard model, that can be easily modified to a custom model. Custom tests are the real benefit though, as they extend automated analysis to all the specific rules of the cadastre.
Custom tests are generally written by Seaconis. However, it is technically possible for others to write tests, as the tests are held in a separate DLL that is not part of the PlanTest install. The framework searches for one or more DLL's in a specific folder that have tests written to a certain template. If they are found, it will include any tests in a list that can be then referenced by properties of steps in the workflows.
Presentation layer - web tech
PlanTest analysis generates considerable results data, usually in the form of messages and tables. PlanTest Examiner Desktop Pro uses web technology in its reports and results windows. This was forward thinking, in that the next release of PlanTest will include a web client for PlanTest Server.
What this means is that you can modify the standard reports by changing the CSS and XSLT style sheets. These files are located in the configuration folder, and can be modified by anyone with a background in web design. Modification of these files are discussed in following sections.
We are currently working on a more flexible reports customisation framework which will allow new reports to be created and accessed much as reference documents are now. That is, automatically added to a reports menu, and able to call custom tests and reference custom web styling files.
CSS styling for your reports
PlanTest differs from much other software in that it is designed to be customised. Use of CSS is one of the easy ways to ensure that it can be customised by methods known to a great many people. Cascading Style Sheets contain the information used by the web to effect everything but the content in web pages. As such, it is extremely powerful. All that is needed is to make a few changes to the CSS, and you have a completely different look.
All reports use CSS files, so all can be adapted to your styles.
XSLT data manipulation for your reports
PlanTest reports use XSLT for manipulation of results data. In combination with CSS files, this gives complete control over report content and styling. Each examination is recorded into a single file (or potentially database BLOB). The examination results file is the source for most reports: summary, decisions and results, test results and so on.
As with the CSS files, XSLT files for each report are held in the configuration folder, and can be modified to alter the content of a report.
Javascript and JQuery
PlanTest employs Javascript and JQuery in its presentation layer. The JQuery framework is a local version, and does not require a connection to the internet. Javascript is used for presentation layer behavior, and is integrated with PlanTest internals.

